


Courtesy of LB4D News: THE TUESDAY REVIEW
 The Census data’s various citywide gains and losses in council districts likely point to a scenario of major adjustments to the nine Long Beach City Council Districts boundaries. Those likely adjustments will come from a domino effect across the city when the legally required population balancing and needs of various Long Beach Communities of Interest are taken into account.
The prospect of those major adjustments came late last week in a Census data report the Long Beach city staff released about the Long Beach numbers from the U.S. 2020 Census. The report was compiled by Redistricting Partners, the consultants hired to advise the new Long Beach Citizens Independent Redistricting Commission (LBCIRC).
The Redistricting Partners report is on the LBCIRC meeting agenda for this Wednesday, September 8, 2021.
The 2020 Census data released in the report last week was from the first release of the 2020 Census data that is known as the “Legacy Data” format[i]. The data shows the population of Long Beach grew from the last Census in 2010 to the 2020 Census by 4,466. That growth number equates to a single percentage of a point in growth for a 2020 total city population of 466,740.
Every 10 years the Census data is used nationwide to adjust (officially called “redistrict”) various political borders to balance the populations as close to equal populations as possible. This is done to ensure the legally mandated “equal representation”. In Long Beach, the LBCIRC is tasked with drawing the boundary lines to balance the populations for the nine council districts using the Census data.
Dividing the total 2020 Long Beach population of 466,740 by nine (the number of council districts) gives the 2020 Census “ideal” number of the total population (not just voters) for each council district at 51,860.
The Redistricting Partners Long Beach Census data report called Existing Districts: 2020 Census (Legacy) shows the 1% city population gain, plus a wide range of population gains and losses across the city’s nine council districts’ current boundary lines.
The task of adjusting the council district lines is more complicated than just adding the 4,466 citywide growth because each of the council districts had a variety of losses and gains that will need to be balanced.
Further complicating the redistricting process for the LBCIRC will be the need to take into account the report’s data addressing the 1965 Voter Rights Act’s ethnic and racial numbers of three “protected” population classes; Asian, Black, and Latino (the Census does not use the Latinx label).
Based on the 2020 Census data presented below, it appears that the current council lines will require major movement to correct the evident data issues.
Big picture Census takeaways for Long Beach
The 2020 Census data shows District 7 had the largest population increase with a growth of 2,834. That is a 5% gain in growth over the 7th District’s 2010 population.
District 5 had the second-highest growth in population at 2,045, a 4% increase. District 5 as currently configured is also closest to the 2020 ideal number of 51,860. The 5th District 2020 Census population is 51,900, only 40 over the required ideal 2020 number making the district nearly statistically perfect.
District 6 had the biggest loss in population, 2,174. That is a 4% loss in population over the 2010 number.
District 4 remained the most stable for gains and losses with only a 48 person increase, statistically a 0% change.
|
|
|
The table on Census population changes by Council District from the released report |

In total, two districts lost population, and seven had population gains. Council Districts 1 and 6 both lost
In total, two districts lost population, and seven had population gains. Council Districts 1 and 6 both lost population. Districts 2, 3, 4, 5, 7, 8, and 9 all gained population (the complete numbers for all data categories from the report are provided by LB4D for each district at the end of The Tuesday Review).
The redistricting laws allow a 10% wiggle room from that “ideal” population number of 51,860 for a council district’s actual numbers. That wiggle room is known as “deviation”.
With the widely varying losses and gains spread throughout the city’s council districts, the data deviation for the city is at a legally unacceptable 14.7% deviation from the ideal population number of 51,860 for each council district. The distinct deviations range from the 6th District’s deviation of 8.9% below the ideal number to the 7th District’s deviation of 5.8% above the ideal number:

The table on Census population deviations by Council District from the released report
The above chart illustrates the challenge of balancing the council districts’ lines. Just to fix the 14.7% population deviation will create a domino effect in each adjoining district as populations are balanced in a neighboring council district.
Data on adults eligible to vote, the CVAP
The voting populations data for the racial and ethnic subgroups that resulted from the 1965 Voting Rights Act are also broken down in the report for each council district. The Long Beach three Census data populations are Asian, Black and Latino. Those populations are reported by the total population of each group. Data for each of the three groups is further reported by the Citizen Voting Age Populations (CVAP)[ii] or the population over 18 in each group who are eligible to vote.
The CVAP is useful in illustrating the potential voting power of protected Census groups. While this valuable information has been often cited in voter suppression court cases, it has limited use in the actual redistricting planning.
The Long Beach Redistricting Partners report notes this about the growth patterns of CVAP in the three protected classes:
“Overall, Adult Citizen [CVAP] growth was 7% among Latinos, 1% among Asians, and there was a loss of 3% among African Americans. Most significant change was the double-digit Latino CVAP growth in Districts 8 and 9, and a shift in two districts, 1 and 9 to more than 45% [CVAP] Latino”
The ideal council district number total ideal population of 51,860 is a total population number, not just voters. The CVAP is a demographic tool that uses the yearly American Community Survey (ACS).
In its Long Beach report, Redistricting Partners breaks the CVAP down by census group and council district:
|
|
|
CVAP chart from the Long Beach Redistricting Partners Report |

It appears that the CVAP information chart (above) labeled “Current ACS” is from the 2015 – 2019 American Community Survey (ACS) numbers.
According to the Census Bureau, the CVAP report will no longer be produced after the 2015-2019 American Community Survey (ACS).
Based on the Redistricting Partners Report data of total population and total CVAP below is the total percentage of all eligible adult voters for each district. The percentages compiled by LB4D from the CVAP report data are for the population over 18 years old of all three census groups plus the percentage of the rest of the population called “other” which is comprised of whites and other smaller Census groups.
The data provides a snapshot of the age divides in each council district. For example, Council District 1’s data shows a total population of 47,384. The CVAP shows a total population over 18 and eligible to vote for District 1 at 25,480. Therefore the data shows, 53.7% of the total population of District 1 are CVAP- or adults eligible to vote.
Total CVAP for each Council District:
District 1: 53.7%
District 2: 70.7%
District 3: 81,1%
District 4: 68.9 %
District 5: 73.5%
District 6: 56.2 %
District 7: 65.9%
District 8: 62 %
District 9: 55.6%
LB Asian Census data presents challenges
With the leaders in the Long Beach Cambodian community having a goal of the Long Beach Cambodian population being concentrated into one district, the “Asian population” data as presented in the Redistricting Partners 2020 Census report presents a challenge to that goal.
What the report currently does not show is the Census data on the diversity in the “Asian population” and the self-identifying race, ethnicity, or national origin of Asians from the 2020 Census.
The report shows one “Asian population” number for the entire city at 59,286. It also reports the “Asian population” number by council districts.
The report’s Census data lacks the breakdown of the “Asian population” between various ethnic groups: Cambodian number, Filipino number, Korean number, Vietnamese number, etc. from the self-identifying part of the Census.
The report’s data does show that Long Beach’s all-encompassing total “Asian population” of 59,286 is widely dispersed across Long Beach.
Using the U.S. Office of Management and Budget’s definition, the Census Bureau defines Asian as:
Asian. A person having origins in any of the original peoples of the Far East, Southeast Asia, or the Indian subcontinent including, for example, Cambodia, China, India, Japan, Korea, Malaysia, Pakistan, the Philippine Islands, Thailand, and Vietnam. This includes people who reported detailed Asian responses such as: “Asian Indian,” “Chinese,” “Filipino,” “Korean,” “Japanese,” “Vietnamese,” and “Other Asian” or provide other detailed Asian responses.
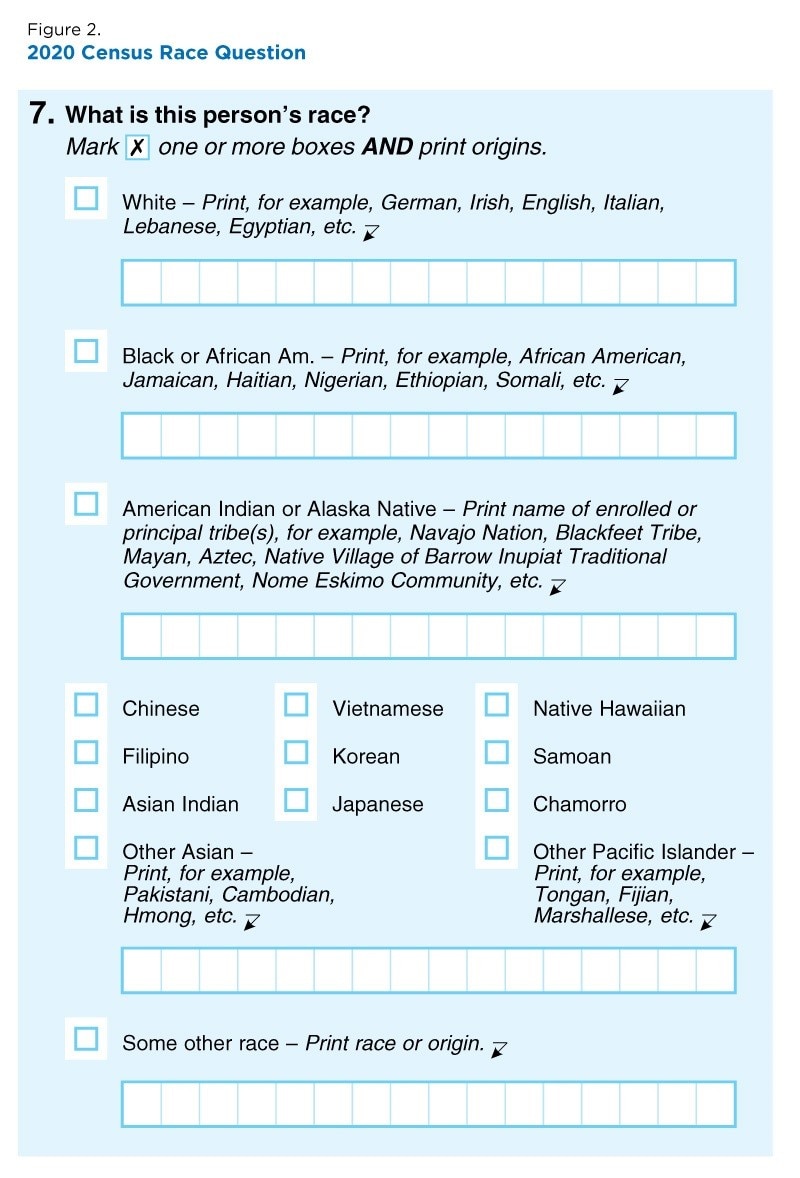
Starting with the 2010 Census, the Census Forms were updated to help capture the diversity inherent in the general terms for “Latino” and “Asian” with self-identification. It includes five write-in examples for Southeast Asians including Cambodians:

In 2020 the Census Form kept the Asian self-identifying question which gives 10 options that include two write-in options that narrow the Southeast Asian examples to three including Cambodian:

It is assumed that Redistricting Partners will use the Census data formated on the Census Buearu’s website to provide the self-identifying Cambodian numbers for Long Beach and where they are located. For now, it appears the prevailing idea to unify the Cambodians just by unifying the blocks around the Mid-Town Business Improvement District (also known as Cambodia Town Business District) into one council district will not produce the numbers the Cambodian leadership wants for a majority Cambodian district.
Previous Census data from the 2011-2016 American Community Survey Census Data, and the 2020 data that shows the 6th District has lost population.

The census tracts with the most Cambodian residents; Retrieved from the 2012-2016 5-year American Census Survey. – courtesy Creative Commons from Wikipedia
The data from the 2015-2019 American Community Survey (ACS) will be used to create what is most likely the last CVAP report.[iii]
The Cambodia Town Business District (aka Midtown) is along East Anaheim Street mostly in the 6th District and partly in the 4th District.
|
|
|
Midtown BID or Cambodia Town- courtesy of the Midtown BID |

However, unifying the Cambodia Town Business District as part of a new Cambodian majority council district by taking the 4th District portion and the blocks surrounding the district does not currently appear as a way to achieve that goal of a unified Cambodian majority council district. In fact, the Redistricting Partners report on the 2020 data shows that the total Long Beach “Asian population” is disbursed widely and not clustered around the Cambodia Town Business District.
The data from the five years 2011-2016 American Census Survey also shows the Cambodia Town area is 60% Latino:

Racial demographic of Cambodia Town in Long Beach, CA. Retrieved from 2012-2016 5-year American Census Survey – courtesy of Creative Commons from Wikipedia
The data from the 2011-2016 American Census Survey also shows the Cambodia Town area has over 80% renters which is a more transient population:

This bar graph compares homeowners and renters in Cambodia Town and Los Angeles County, Retrieved from the 2012-2016 5-year American Census Survey. – courtesy of Creative Commons from Wikipedia
Unlike the 2020 Census data on the Latino numbers citywide, the 2020 Census data appears not to support a Cambodian majority population district.
The 2020 Census data shows that the 7th District has by far the largest total “Asian population” with 12,513 (22.8% of the district population) followed by the 6th District with 8,947 (18.9%) and the 4th District with 7,601 (14.8%). The current 6th District does share borders with both the 7th and 4th Districts.
The 5th, 8th and 9th have the next three largest “Asian populations” accounting together for a total of 33% of the entire Asian population. None of those three districts share a border with the 6th District or are near the Cambodia Town business district. The Asian population in those three districts is assumed to be widely dispersed.
LB Data on Latino and Black populations
Also widely dispersed is the city’s Black population, The council district with the largest Black population is the 8th District with a population of 10,136 or 18.7% followed by the 9th District with 8,445 or 15.5%. The 8th District’s Black CVAP is 8,023 or 23.8%. The 9th District’s Black CVAP is 6,958 or 22.9%.
The 3rd and the 5th Districts are the only two districts with less than a 10% Black population. The 3rd has 3.7% and the 5th has 3.8% of the city’s Black population.
The 9th District has the largest Latino (the Census does not use “Latinx”) population with 34,187 or 62.6%. Of that population, 14,646 are CVAP or 48% of the voting population in District 9.
Two other council districts are majority Latino districts:
- District 1 with a Latino population of 28.118 which is 59.3% of the district’s population. The CVAP Latino population is 11,419 or 44.8% of the district voters.
- District 6 with a Latino population of 26,436 which is 55.9% of the district’s population. The CVAP Latino population is 11,419 or 41.4% of the district voters.
While not an outright majority Latinos make up the largest percentage of the population subgroups in Districts 4, 7, and 8.
Summary of Census data on all LB Council Districts
Below is a LB4D data summary by each council district of the data presented in this posting. Note that the data is for the current council district lines. Based on the 2020 Census data, it appears most likely that the current council district lines will require movement.
District 1= 2020 population 47,384
LOST population: 1,733 = 4% loss
Current boundries are 4,476 short of the 51,860 target
Deviation percent from 51,860 target = -8.6%
Latino = 59.3%
Asian = 7.3%
Black = 14.9%
Whites & others = 18.5%
Percent of population that is eligible to vote = 53.7%
District 2 = 2020 population 51,558
GAINED population: 326 = 1% gain
Current boundries are 302 short of the 51,860 target
Deviation percent from 51,860 target = -0.6%
Latino = 39.6%
Asian = 8.9%
Black = 11.7%
Whites & others = 39.8%
Percent of population that is eligible to vote = 70.7%
District 3 = 2020 population 52,328
GAINED population: 997 = 2% gain
Current boundries are 1,457 over the 51,860 target
Deviation percent from 51,860 target = + 2.8%
Latino = 20.1%
Asian = 8.0%
Black = 3.7%
Whites & others = 68.2%
Percent of population that is eligible to vote = 81.1%
District 4 2020 population 51,504
LOST population: 48 = 0%
Current boundries are 356 short of the 51,860 target
Deviation percent from 51,860 target = -.07
Latino = 39.6 %
Asian = 14.8%
Black = 10.6%
Whites & others = 35 %
Percent of population that is eligible to vote = 68.9%
District 5 2020 population 51,900
GAINED population: 2045 = 4% gain
Current boundries are 40 over the 51,860 target
Deviation percent from 51,860 target = .01%
Latino = 26%
Asian = 10 %
Black = 3.8%
Whites & others = 60.2%
Percent of population that is eligible to vote = 73.5%
District 6 2020 population 47, 270
LOST population: 2174 = -4% loss
Current boundries are 4,590 short of the 51,860 target
Deviation percent from 51,860 target = -8.9%
Latino = 59.9%
Asian = 18.9%
Black = 14.7%
Whites & others = 10.5%
Percent of population that is eligible to vote = 56.2%
District 7 2020 population 54,847
GAINED population: 2834 = 5% gain
Current boundries are 2,987 over the 51,860 target
Deviation percent from 51,860 target = +5.8
Latino = 39.6%
Asian = 22.8%
Black = 14.5%
Whites & others =23.1%
Percent of population that is eligible to vote = 65.9%
District 8 2020 population 54,332
GAINED population:1323 = 2% gain
Current boundries are 2,472 over the 51,860 target
Deviation percent from 51,860 target = + 4.8%
Latino = 48.8%
Asian = 13.2%
Black = 18.7%
Whites & others = 19.3%
Percent of population that is eligible to vote = 62%
District 9 2020 population 54,628
GAINED population: 800 = 1 % gain
Current boundries are 2,786 over the 51,860 target
Population needed for 51,860 target = + 2,768 total
Deviation percent from 51,860 target = +5.3%
Latino = 62.6%
Asian = 10.2%
Black = 15.5%
Whites & others = 11.7%
Percent of population that is eligible to vote = 55.6%
____________________________________
The Redistricting Partners report is on the LBCIRC meeting agenda for this Wednesday, September 7, 2021.
[i] The Legacy Data format is similar to a raw data dump that releases the official Census data in zip files. Data specialists, such as Redistricting Partners and state agencies can use the zip files to start extracting the information they need before that same data is posted on the Census Bureau website. That September release is the exact same data, but in a more user-friendly form on the Census website.
[ii] There has been controversy with the CVAP and Pres. Biden issued an Executive Order that effectively ended the Post-2020 Census CVAP Special Tabulation and other citizen-centered tabulations. The last CVAP will be issued using American Community Survey (ACS) 5-year estimates using 2015-2019 data.
[iii] “The Census Bureau suspended all work on the Post-2020 Census CVAP Special Tabulation on January 12, 2021 following the Executive Order on Ensuring a Lawful and Accurate Enumeration and Apportionment Pursuant to the Decennial Census.” – US Census Bureau


